The world is slowly but surely moving out of one of its biggest crisis that has impacted all spheres of life and business. The year 2020 will go down in the history as the crash year when businesses and economies came to a standstill. The apparel trade was in fact one of the worst hit industries, being considered a lifestyle sector and not a basic necessity though increase in requirements of PPE and other health and well-being related clothing did keep the industry afloat. However, now not only trade is looking up but all markets are moving back to growth rates that were considered ‘normal’ before the pandemic took over!
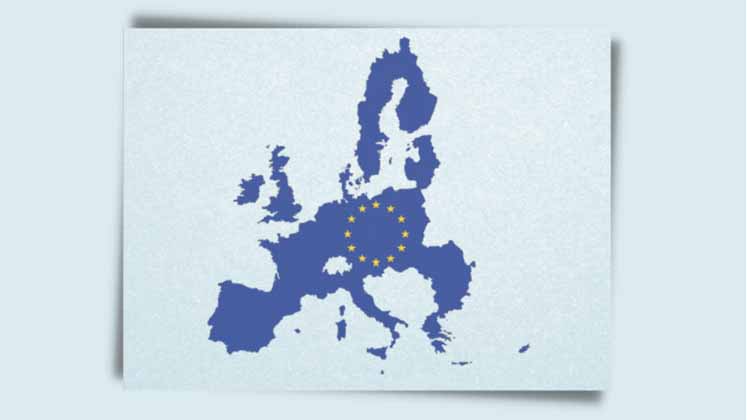
The EUis the world’s largest importer of apparel and textiles and accounts for nearly 21 per cent of the world’s apparel and textile imports value, according to World Trade Organization (WTO).Like all other markets, the EU market also experienced a serious turbulence in its growth and Eurostat statistics claim that the overall European apparel import market was valued at € 127.4 billion (both Intra-EU and Extra-EU) in 2020 – down from € 129.3 billion in 2016 and € 146.90 billion in 2019. Significantly, the market grew by an average annual rate of 4.70 per cent from 2016 to 2019 but sharply fell by 13.30 per cent between 2019 and 2020 due to the COVID-19 pandemic and a weakening of the international trade in 2020.
In terms of number of clothing used, EU imported roughly 23.70 billion units of clothing in 2020, up from 19.20 billion in 2016 and that’s quite surprising seeing values went down in the same period. According to Eurostat, the average growth rate since 2016 is still slightly positive, at 0.8 per cent per year. Before 2020, the market grew by an average annual rate of 4.7 per cent from 2016 to 2019 and experts project that the EU is slowly crawling back to this growth rate despite continuous setbacks by the cycle of Covid that is holding the world at ransom. So what can the industry expect from the EU market as it regains lost ground?
The EU and its 5-Year Import Performance…
Currently, the value of the EU imports is evenly split between apparel originating from inside the EU and apparel originating from outside the EU (values mentioned in Table 1), at 50.80 per cent and 49.20 per cent respectively. In 2020, developing country suppliers contributed 44.9 per cent of all clothing imports into the EU in terms of value (down from 49.8 per cent in 2016) and suppliers from the rest of the world accounted for 4.3 per cent of the value (down from 6.7 per cent in 2016).
Europe’s Extra-EU apparel imports are dominated by Asian countries with China, Bangladesh and Turkey being the top three exporters together accounting for 27.3 per cent of all apparel imports into the EU. China is the single largest apparel exporter to the EU with 12.2 per cent of the EU imports value in 2020, while its share strongly declined from €21.9 billion in 2015 to €15.6 billion in 2020. It is followed by Bangladesh with 9.5 per cent and Turkey with 5.5 per cent.
Other top 10 exporters from outside the EU have import shares between 1-3 per cent of the overall value. Bangladesh, Vietnam, Cambodia, Pakistan and Myanmar each increased their shares in the EU apparel imports between 2015 and 2020. Myanmar has been the fastest grower, with a yearly apparel imports value increase of 39.4 per cent, taking its exports from €349 million in 2015 to €1.8 billion in 2020. This example highlights the potential for other, previously unnoticed developing countries to import to the EU.
Table 1: Top 10 Extra-EU Exporters to EU
| Country | Value (in € billion) in 2020 |
5-year average annual growth rate till 2020 |
| China | 15.6 | -6.6% |
| Bangladesh | 12.1 | +1.2% |
| Turkey | 7.0 | -0.7% |
| United Kingdom | 3.7 | +1.0% |
| India | 2.8 | -5.0% |
| Vietnam | 2.3 | +2.2% |
| Cambodia | 2.3 | +1.3% |
| Pakistan | 1.9 | +4.0% |
| Morocco | 1.9 | -1.9% |
| Myanmar | 1.8 | +39.4% |
Source: Eurostat
Bangladesh and the United Kingdom have been the only two out of the top 5 Extra-EU exporters to grow in the last 5 years. From 2016 to 2020, China registered an average annual decline of 6.6 per cent and Vietnam, Cambodia and Pakistan grew between 1.3 per cent and 4.0 per cent respectively. Those dynamics show the growing opportunity for other developing countries to increase their apparel exports to the EU, while China is expected to further decrease in market shares.
Why is China declining and is expected to further decline…?The production in China is becoming increasingly expensive due to labour force shortages, and the trade war with the United States. In addition, the Chinese Government has also introduced new environmental legislations following their signature of the Paris Agreement on climate change. The country’s higher environmental standards, especially after its new Environment Protection Law that came into existence in 2015 and cracked down on tens of thousands of non-compliant factories, are predicted to force over 80,000 Chinese factories to shut down. This number is approximately 40 per cent of total factories in China including apparel ones. Additionally, the Chinese apparel market strongly suffered from the COVID-19 pandemic, productions were partly stopped, and imports were cut short.
Which European markets offer most opportunities for apparel exporters?
Pants is the biggest product segment, but the fastest growing and most attractive product category is Dresses and Skirts, whereas Swimwear and Active Sportswear also represent an interesting new apparel segment recently targeted by the buyers.
As per the data, Western European apparel markets are much larger than the Central and Eastern European markets. The top 6 apparel import markets in the EU are Germany, France, Spain, Italy, the Netherlands and Poland. While some Eastern European countries are growing at much higher rates than Western Europe, they are still relatively small in market size. Poland is a market to watch due to its fast growth of imports from the developing countries and an already sizeable market.
Table 2: Top 10 EU Importers of Apparel
| Country | Value (in € billion) in 2020 |
5-year average annual growth rate in values |
| Germany | 30.2 | +0.9% |
| France | 17.1 | -1.7% |
| Spain | 14.0 | -0.3% |
| Italy | 11.5 | -1.7% |
| The Netherlands | 11.4 | +0.1% |
| Poland | 8.7 | +13.3% |
| Belgium | 6.6 | -0.6% |
| Austria | 5.1 | +2.1% |
| Denmark | 3.8 | +0.8% |
| Sweden | 3.6 | +1.8% |
Source: Eurostat
At €30.2 billion value, Germany was the largest apparel importer in the EU in 2020. It is followed by France, Spain, Italy, the Netherlands and Poland. Together, these top six countries account for nearly 72.9 per cent of the entire EU apparel import market. In the last five years, Poland has been the fastest grower within this group. The value of its apparel imports has grown each year on an average by 13.3 per cent. It was followed by Germany with an average growth of 0.9 per cent. Poland itself accounts for 6.8 per cent of all EU imports, making it the 6th largest importer of apparel in the EU.
The fastest growing EU markets include Poland, Romania, Czech Republic, and Hungary with each country growing on an average between 5.6 per cent and 13.3 per cent. Despite the fast growth, these four countries together account for only 10.9 per cent of the EU apparel market.
The primary apparel exporter to the top six EU apparel markets is still China. Its import market share within the top 6 import market ranges from 18.1 per cent for the Netherlands to 9.8 per cent for Poland. Its share has decreased over the last 5 years in the top 6 European import markets.
Table 3: Main markets in EU and percentage share of main exporters…
| Germany | Major Exporters: % share |
| Poland (14.6%), Bangladesh (12.3%), China (11.5%), The Netherlands (8.1%), Turkey (7.4%) | |
| France | Major Exporters: % share |
| China (15.2%), Germany (11.5%), Spain (9.7%), Italy (9.2%), Bangladesh (8.5%) | |
| Spain | Major Exporters: % share |
| Bangladesh (16.4%), Turkey (14.5%), China (13.0%), Morocco (8.6%), Italy (6.3%) | |
| Italy | Major Exporters: % share |
| China (14.2%), Bangladesh (9.6%), Spain (8.8%), France (8.0%), Germany (4.3%) | |
| Netherlands | Major Exporters: % share |
| Germany (22.6%), China (16.9%), Bangladesh (10.1%), Turkey (7.0%), Spain (4.3%) | |
| Poland | Major Exporters: % share |
| Germany (42.8%), Bangladesh (10.7%), Spain (9.8%), China (9.3%), The Netherlands (3.4%) |
Source: Eurostat
Developing Countries Edge Ahead in Exports to the EU market…
Developing countries contributed significant shares to the import values of all top six apparel markets, ranging from 15.2 per cent in Austria to 70.1 per cent in Spain. Germany, France, Spain, Italy, the Netherlands, and Poland account for 80.5 per cent of all apparel imports from developing countries. Germany remains the single largest importer by value of apparel from the developing countries. Poland has shown the strongest growth of 18.1 per cent within the last 5 years.
The overall trends for the top six markets show that the export opportunities for the developing countries are generally growing, but have experienced losses due to the COVID-19 pandemic and related trade restrictions. The strongest growth in imports from the developing countries was observed in Poland (18.1 per cent average yearly growth) and Austria (3.2 per cent).
Unit prices scenario…
The price levels of imported clothing vary considerably across the EU Member States, with the highest prices observed in Scandinavia and the lowest prices observed in parts of South-East Europe. According to Eurostat, the highest prices for apparel were recorded in Latvia (36 per cent higher than the EU on an average), followed by Austria (33 per cent) and Sweden (24 per cent). Malta was the least expensive country for clothing (21 per cent lower than the EU average), followed by Greece (15 per cent) and Bulgaria (12 per cent).
The average unit prices of imported apparel vary between the top markets and are based on the import origin. Apparel imported from other European countries is typically 1.5-2.6 times more expensive on unit basis than apparel imported from outside the EU and that’s where exporters outside EU hold superiority. Latvia has the highest unit prices for extra-EU imports with an average of €9.29 per unit and Greece has the lowest average unit import prices at €1.83 per unit. Latvia, Hungary and Romania have experienced the biggest decline in the average unit prices for developing country imports over the last five years, whereas countries like Bulgaria, Estonia and the Netherlands have experienced the greatest growth in prices.
Table 4: Average unit prices of Extra-EU imports of top 6 EU importers
(Value in €)
| Country | Average Unit Price of Extra-EU imports (in 2020) |
Total 5-year change |
| Germany | €10.75 | +€1.05 |
| France | €8.28 | +€0.02 |
| Spain | €12.40 | +€0.55 |
| Italy | €11.29 | +€0.70 |
| The Netherlands | €11.09 | +€4.45 |
| Poland | €11.24 | +€2.75 |
Source: Eurostat
These products from the developing countries have the most potential in the European apparel market…
At €28.60 billion in value, Pants (Trousers) is the largest apparel product category imported into the EU and accounts for 22.50 per cent of all apparel imports, as per Eurostat. It is followed by Shirts and Blouses, Coats and Jackets, Knitwear and Dresses and Skirts. These five categories together account for 78.30 per cent of all apparel imports to the EU. Dresses and Skirts, Swimwear and Active Sportswear, and Coats, Jackets and Blazers are the fastest growing product categories by import value.
In the last five years, the Dresses and Skirts import value has grown on an average by 5.20 per cent each year and the other top 5 categories have each grown by an average of 1.70 per cent each year. The Sportswear category has also grown significantly, by 2.80 per cent, which is driven by its functionality and the EU population’s growing inclination to participate in sports due to rising health consciousness. At the same time, Shirts and Blouses (-2 per cent), Denim (-1 per cent)and Suits and Ensembles (-0.6 per cent) have decreased in share.
Table 5: EU apparel imports by product category
| Product Category | Value | 5-yr average annual growth rate |
| Pants | €28.6 billion | +1.6% |
| Shirts and Blouses | €24.6 billion | -2.0% |
| Coats, Jackets, Blazers | €18.7 billion | +1.7% |
| Knitwear | €17.1 billion | +1.7% |
| Dresses and Skirts | €10.7 billion | +5.2% |
| Nightwear and Intimates | €9.0 billion | +0.0% |
| Denim | €7.4 billion | -1.0% |
| Swimwear and Active Sportswear | €4.0 billion | +2.8% |
| Suits and Ensembles | €4.0 billion | -0.6% |
| Kidswear | €3.2 billion | +0.7% |
| TOTAL: | €127.4 billion | +0.8% |
Source: Eurostat


